How to use Cryptoland Scout in real life trading?
When you have good software and Cryptoland Scout is great software you just need an example of how it works in real life trading.
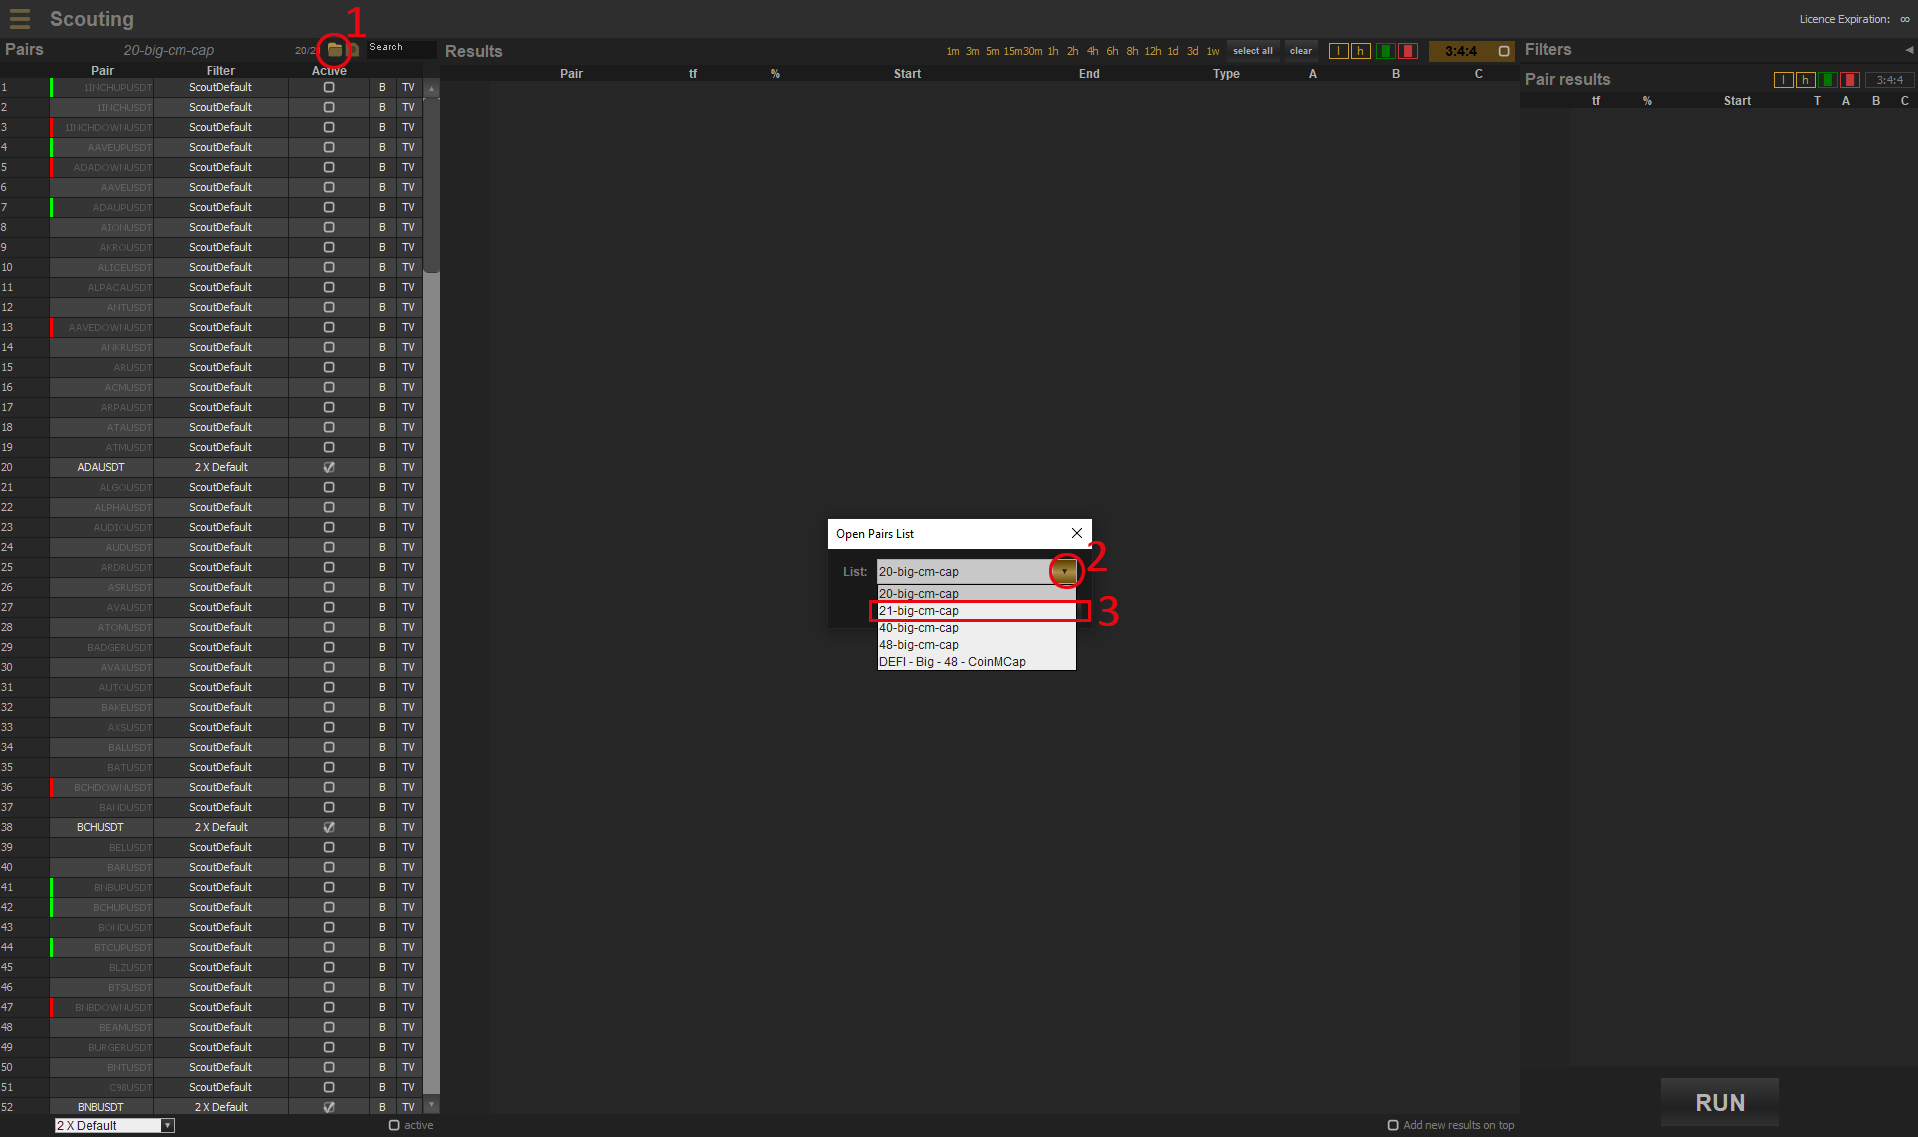
When all the pairs have been loaded, (the panel on the left will be filled in) the program is ready for analysis.

Select the pairs you are interested in either manually or load some of the selections already made. For example, the list of 21-big-cm-cap represents the largest 21 currencies by value (market cap) that are listed on the Binance exchange office, all according to the website https://coinmarketcap.com. We also have lists with 40 and 48 coins, respectively. There is also a list of the 48 largest currencies but only from the DEFI sphere.
If we are not satisfied with the current selection, then use the “active” checkbox to turn currencies on or off from the selection. When we are satisfied with the selection, we can record it so that we can have it for the next time. Finally, it was time to analyze the current state of currencies. This is accomplished by pressing the RUN key in the lower right corner located in the right vertical panel.

This will start the process of communicating between Cryptoland Scout and Binance Exchange. Depending on the number of pairs, the synchronization will take some time, but it should take less than 2 minutes.

When the program has finished its initial synchronization, we are left to wait for it to release the results and to make decisions based on them whether to enter in trade or not.
In order to make the right decisions, you need to know a few basic concepts related to the patterns that the program looks for and how trading is based on them.
WHAT IS A “l” PATTERN
A pattern that resembles the lowercase Latin letter “l” is called an l pattern. You can often hear the term “leg”. If the leg is composed of red candles then it is a drop in price and it is a classic leg. If the leg consists of a green candle then it is a price increase and it is called an inverse leg.

WHAT IS A “h” PATTERN
A pattern that resembles the lowercase Latin letter “h” is called an h pattern.
There is a classic “h” pattern where you start with a downward drop (A segment), then a price jump – pull back, (B segment) then there is a price drop again – correction (C segment) and then again comes the price increase. There is also an inverse (inverse) x pattern that has inverted segments, (growth, decline, growth, decline). The point that is suitable for entering the trade is after the end of the third segment, ie at the beginning of the fourth segment. There are several tactics for getting out of a trade. It is easiest to come out at the appearance of a candle of the opposite color from the color of the fourth segment, but it is also so often to come out ahead of time. Experience will help you better assess when to go out.

WHAT SHOULD A “h” PATTERN THAT IS GOOD FOR TRADE LOOK LIKE?
Regardless of the time frame, an “h” pattern that is good for trade must have all three segments with more than 3 candles. It is desirable that the number be 5 candles or greater. The angle between the segments should be pronounced and resemble the letter “V”. Segment B must not be larger than 70% (in terms of height) of the segment.

WHICH “h” PATTERNS ARE NOT GOOD FOR TRADE?
As we have already mentioned, there are situations when, although there is an h pattern, it will not be suitable for trading. These are the following cases:
- fake “h” pattern
- weak “h” pattern
- short “h” pattern
- hanging “h” pattern
WHAT IS A FALSE “h” PATTERN ?
It will happen that the program gives you a result that can be nominally assumed to be an h pattern, but it is not. If the rule red segment, green segment, the red segment is fulfilled (or vice versa in the case of the inverse h pattern) and we have that the leg had a drop given by the filter, we will have an h pattern in the result. However, it very often happens that the B segment is one candle (or two) in dojo shape or a very weakly expressed candle, then we are talking about a “false h pattern” that is not suitable for trade. This pattern often is very similar with “short h” pattern.
WHAT IS A WEAK (FLAT) “h” PATTERN ?
When we have all the characteristics of the h pattern but the angle between the A and B segments as well as the angle between the B and C segments is small then it is a “weak h pattern”. Since this h pattern is “flat”, it usually does not have the power to cause any further change and you should skip the trade from its pattern.
WHAT IS A SHORT “h” PATTERN ?
If there are one or more segments that consist of only one (or two) candles, it is a “short h pattern”. Such a pattern does not provide enough information on how the price will develop further and should be skipped.

WHAT IS A HANGING “h” PATTERN ?
When the third segment (in the case of red, green, red) is below the first segment by more than a quarter of the height of the first segment, then we say that it is a “hanging h pattern”. This pattern threatens to turn into one long leg in larger time frames. This is also not a good pattern for trading.